Functions stat_
functions_stat.Rmdstat_ functions apply statistical methods and show the
results in an gt table, let’s create a example data.frame
to apply them.
set.seed(1234);df <-
  data.frame(
    grp_var = sample(paste("group", letters[1:2]),size = 100,replace = TRUE),
    cat_var1 = sample(letters[1:3],size = 100,replace = TRUE),
    cat_var2 = sample(letters[25:26],size = 100,replace = TRUE),
    num_var1 = c(rnorm(66),rep(NA,34)),
    num_var2 = c(rpois(80,2),rep(NA,20)),
    num_var3 = c(rexp(40,2),rep(NA,60))
  )
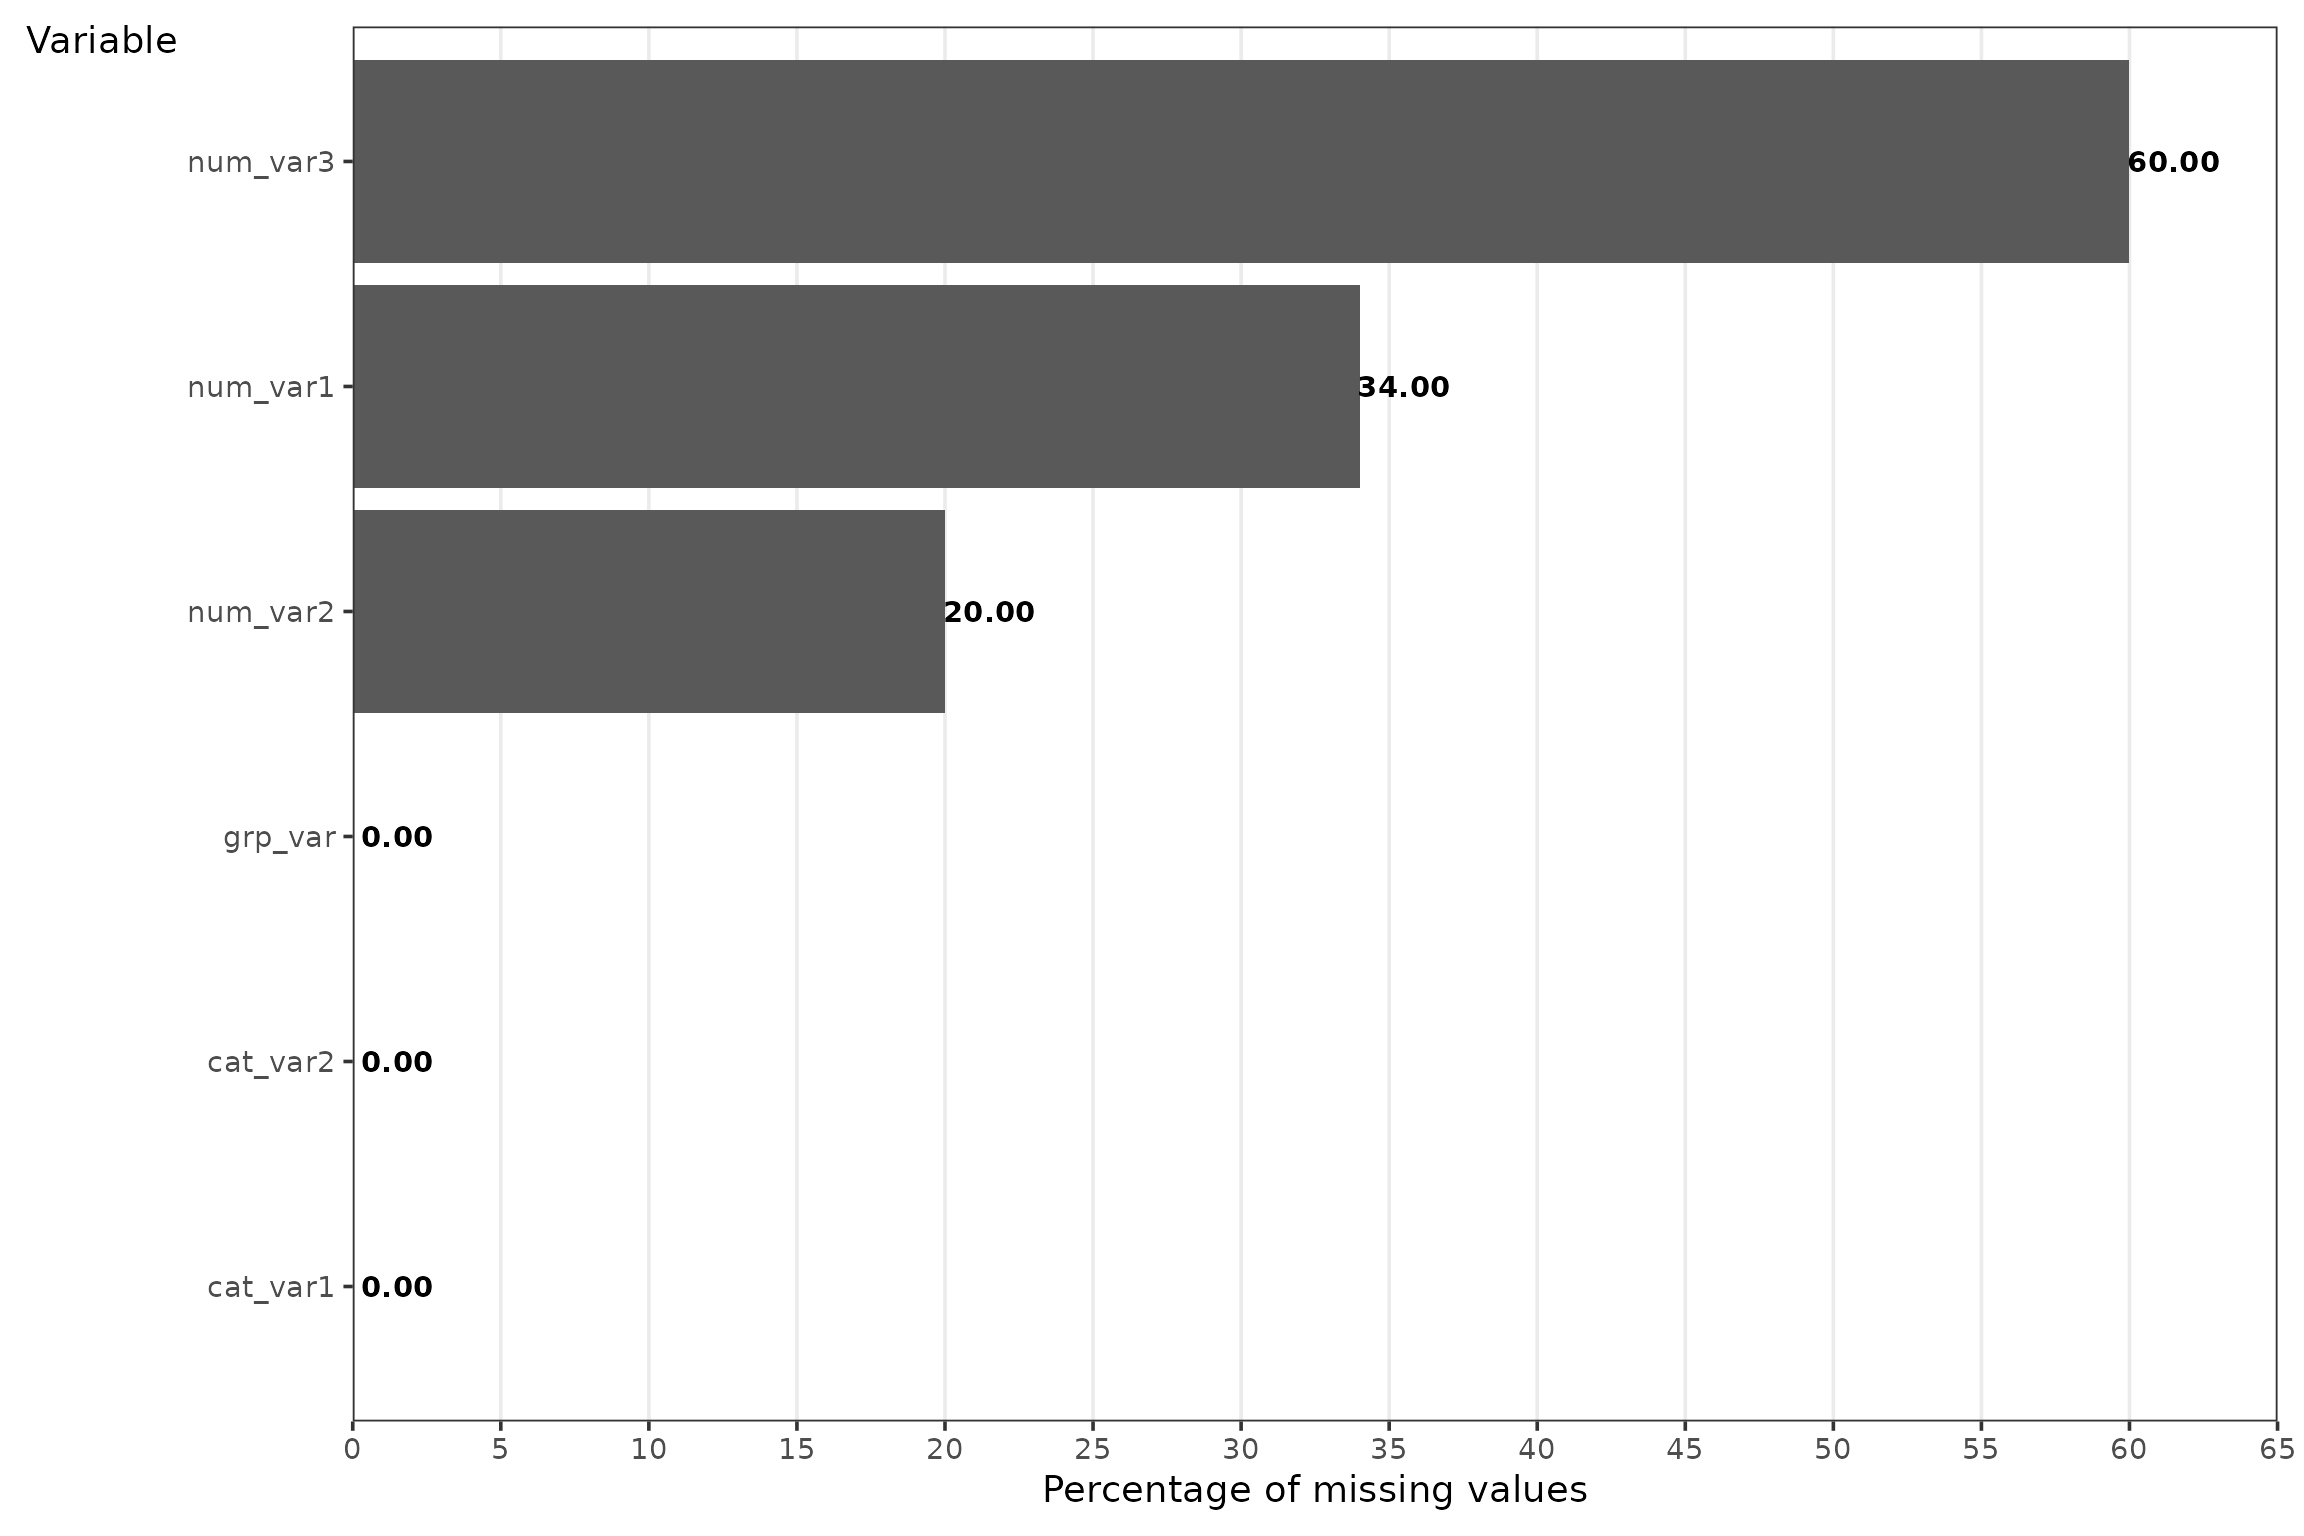
stat_missing_values
The goal of stat_missing_values is to identify the
variables with most missing values

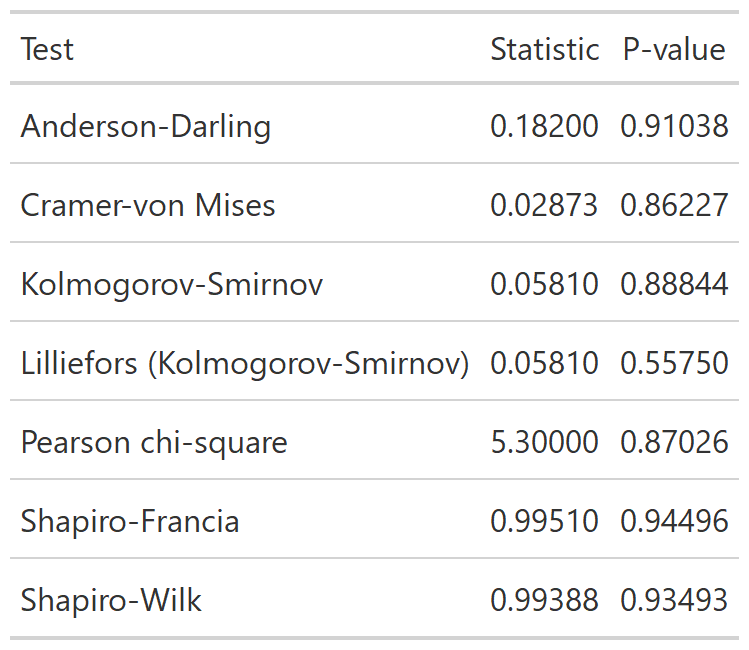
stat_normality
The goal of stat_normality is to test the normality of
the data.
set.seed(123);x <- rnorm(100)

stat_normality(x,digits = 5)
#> # A tibble: 7 × 4
#>   test                                     statistic p_value is_normal
#>   <chr>                                        <dbl>   <dbl> <lgl>
#> 1 Anderson-Darling                            0.182    0.910 TRUE
#> 2 Asymptotic one-sample Kolmogorov-Smirnov    0.0581   0.888 TRUE
#> 3 Cramer-von Mises                            0.0287   0.862 TRUE
#> 4 Lilliefors (Kolmogorov-Smirnov)             0.0581   0.558 TRUE
#> 5 Pearson chi-square                          5.3      0.870 TRUE
#> 6 Shapiro-Francia                             0.995    0.945 TRUE
#> 7 Shapiro-Wilk                                0.994    0.935 TRUE
You can also print as a gt table, by setting the
argument print to TRUE.

Result of the function stat_normality.
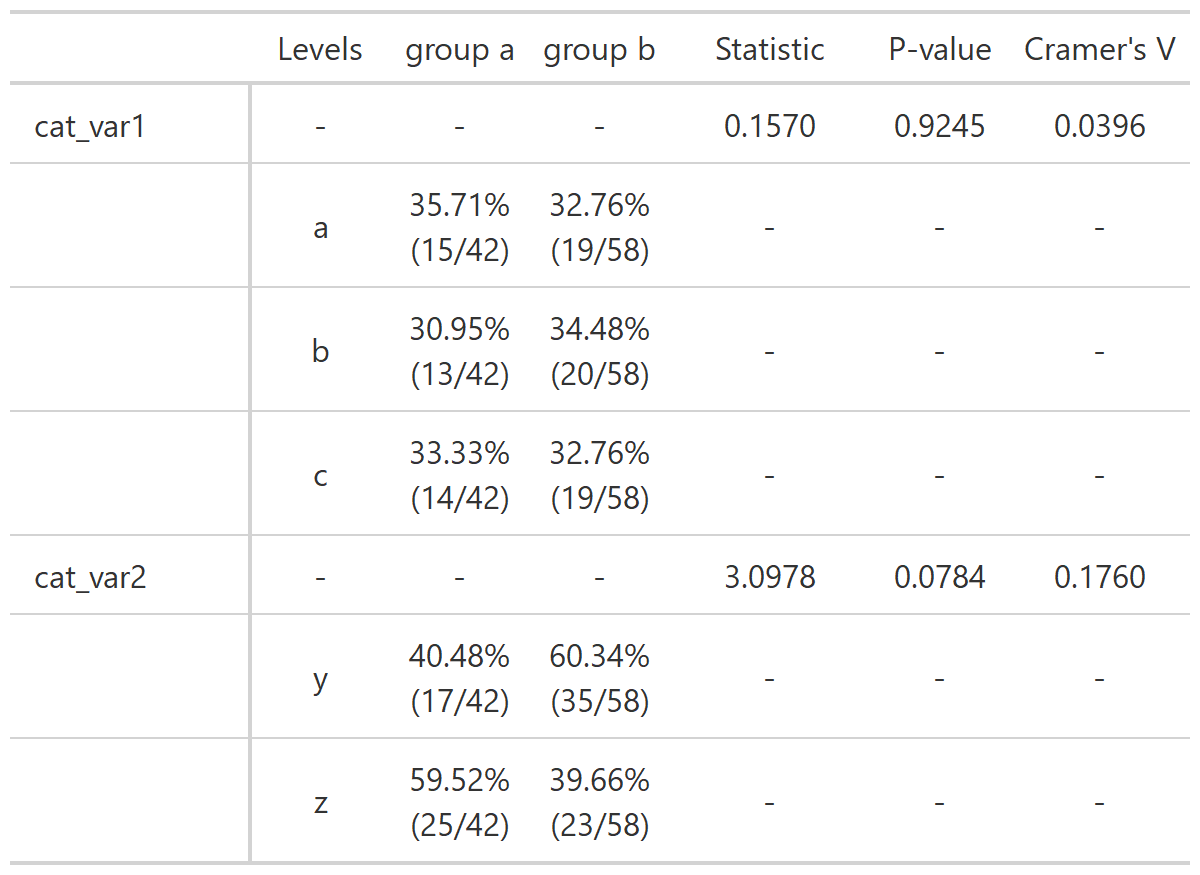
stat_two_cat
The goal of stat_two_cat is to create a frequency table
with chi-square statistic, p-value and Cramer’s V.
df %>%
  stat_two_cat(
    df = .,
    grp_var = grp_var,
    vars = c(cat_var1,cat_var2)
  )
Result of the function stat_two_cat.
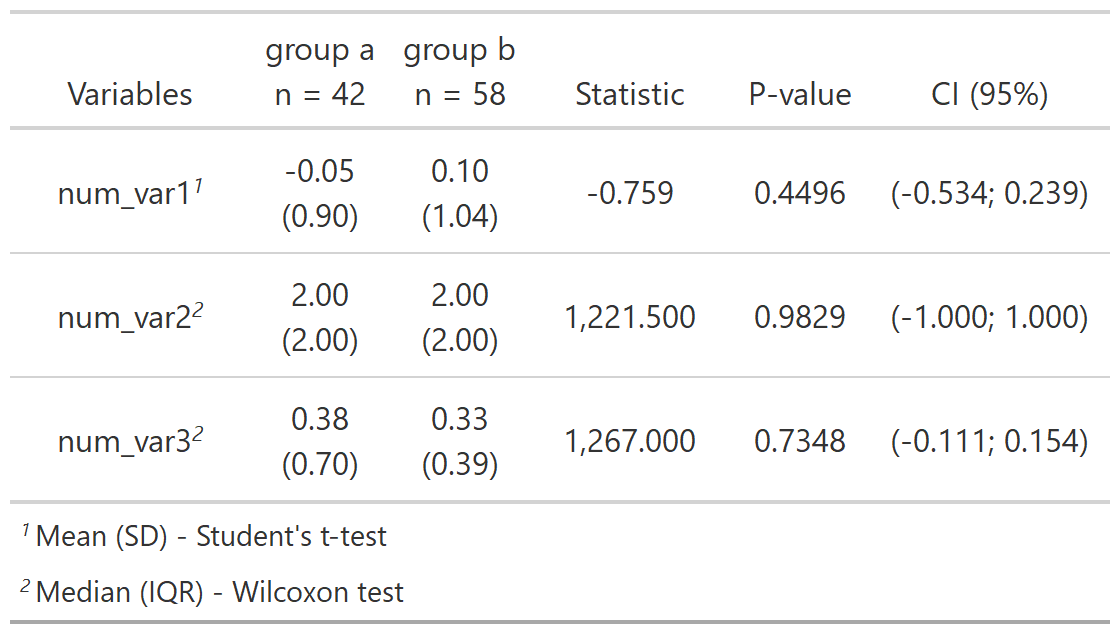
stat_two_num
The goal of stat_two_num is to create a summary table
comparing one or more numerical variables between two groups.
df %>%
  stat_two_num(
    df = .,
    grp_var = grp_var,
    num_vars = c(num_var1,num_var2,num_var3)
  )
Result of the function stat_two_num.