Other functions
other_functions.Rmdcount2
The goal of count2 is to count the number of
observations, giving a initial count.
count2(mtcars,cyl)
#> Storing counts in `nn`, as `n` already present in input
#> ℹ Use `name = "new_name"` to pick a new name.
#>    n nn
#> 1  7  1
#> 2 11  1
#> 3 14 1cut_by_quantile
The goal of cut_by_quantile is to divide a numeric
variable by a set of quantiles.
set.seed(123);x <- rnorm(100)

quartiles <- seq(0,1,by = .25)

table(cut_by_quantile(x,q = quartiles))
#>
#>  [-2.31,-0.494] (-0.494,0.0618]  (0.0618,0.692]    (0.692,2.19]
#>              25              25              25              25
expand_grid_unique
The goal of expand_grid_unique is to create a grid of
all combination from two variables, with no repetition of pairs, not
matter the position.
expand_grid_unique(x = 1:3,y = 1:3)
#> # A tibble: 3 × 2
#>      V1    V2
#>   <int> <int>
#> 1     1     2
#> 2     1     3
#> 3     2     3
You can also set the argument include_equals to
TRUE, so equal pairs are kept.
expand_grid_unique(x = 1:3,y = 1:3, include_equals = TRUE)
#> # A tibble: 6 × 2
#>      V1    V2
#>   <int> <int>
#> 1     1     1
#> 2     1     2
#> 3     1     3
#> 4     2     2
#> 5     2     3
#> 6     3     3
obj_to_string
The goal of obj_to_string is to return the name of an R
object as a string.
x <- c(1,2,3,5,7,8,12,100)

obj_to_string(x)
#> [1] "x"
replace_boolean
The goal of replace_boolean is to replace the values of
a boolean variable to other values.
replace_boolean(c(T,T,T,F,F),1,2)
#> [1] 1 1 1 2 2
replace_na
The goal of replace_na is to replace the NA value to
another.
replace_na(c(NA,NA,NA),1)
#> [1] 1 1 1
row_number_unique
The goal of row_number_unique is to get the row number,
but considering the unique values of a variable.
tibble(x = c(1,1,1,2,3,4,5,5)) %>%
  mutate(
    row_number = row_number(),
    row_number_unique = row_number_unique(x)
  )
#> # A tibble: 8 × 3
#>       x row_number row_number_unique
#>   <dbl>      <int>             <int>
#> 1     1          1                 1
#> 2     1          2                 1
#> 3     1          3                 1
#> 4     2          4                 2
#> 5     3          5                 3
#> 6     4          6                 4
#> 7     5          7                 5
#> 8     5          8                 5
rpearson
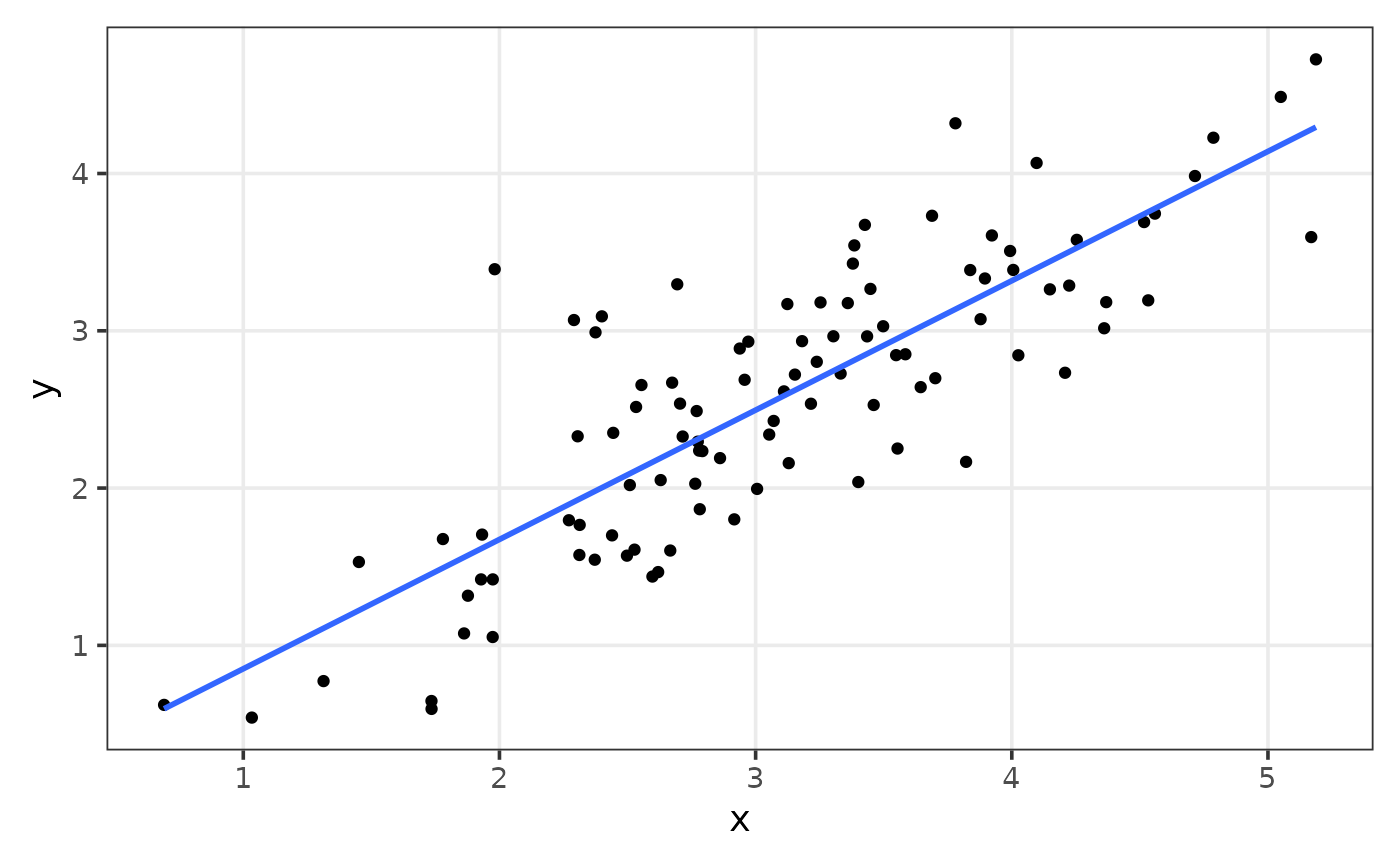
The goal of rpearson is to simulate data, where two
variables will be linear correlated with a normal distribution, using
pearson correlation coefficient as an argument.
set.seed(123);df <- rpearson(n = 100, pearson = .85, mean = 3)

df %>%
  ggplot(aes(x,y))+
  geom_point()+
  geom_smooth(method = "lm", se = FALSE)+
  plt_theme_xy()
#> `geom_smooth()` using formula = 'y ~ x'