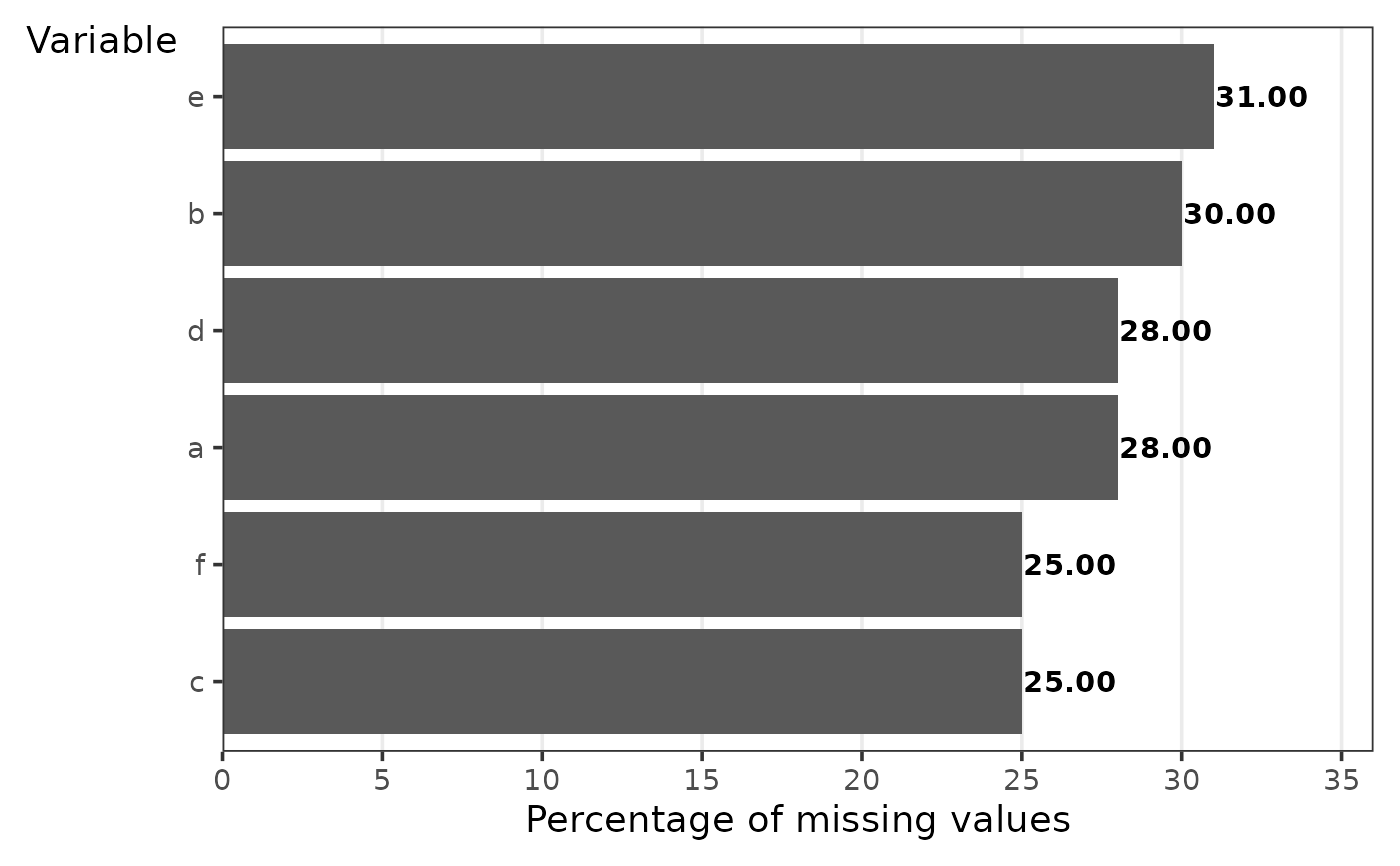
Calculate the percentage of missing values
stat_missing_values.Rdpercentage of missing values for each variable.
Examples
vector <- c(1:10,rep(NA,4))

set.seed(123);data <-
data.frame(
 a = sample(x = vector,size = 100,replace = TRUE),
 b = sample(x = vector,size = 100,replace = TRUE),
 c = sample(x = vector,size = 100,replace = TRUE),
 d = sample(x = vector,size = 100,replace = TRUE),
 e = sample(x = vector,size = 100,replace = TRUE),
 f = sample(x = vector,size = 100,replace = TRUE)
 )

stat_missing_values(data)