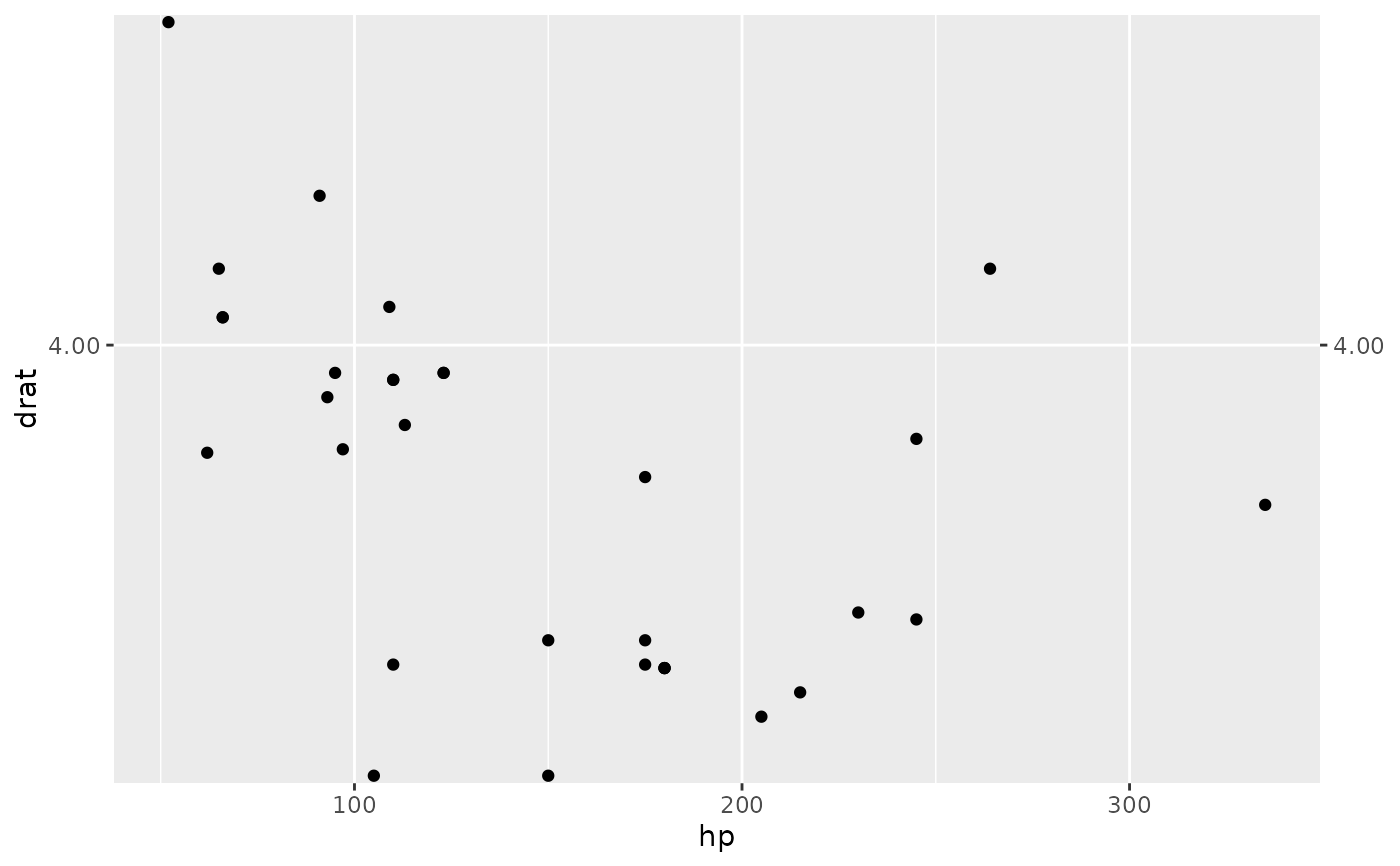
ggplot2: Mirror the y axis on the right side
plt_scale_y_mirror.RdMirror the ticks and text from the y axis on the right side.
Usage
plt_scale_y_mirror(breaks, labels = NULL, expand = c(0.01, 0), ...)Arguments
- breaks
A numeric vector, that will be the breaks in the y axis
- labels
A vector (default = NULL), that will be the labels in the axis, if not provided 'breaks' will be used instead
- expand
A numeric vector (default = c(0.01,0)), that is the range expansion used to add some space between the data and the plot border