ggplot2: Add an automatic scale to a plot
plt_scale_auto.RdCreate a automatic scale to a ggplot2 plot.
Usage
plt_scale_auto(
  axis = c("x", "y", "xy", "both"),
  n_breaks = 10,
  expand = 0.01,
  thousand_mark = ".",
  decimal_mark = ","
)
Arguments
- axis
A character single value (default = 'x'), that will be the axis to scale, must be x, y or xy
- n_breaks
A numeric integer single value (default = 10), that will be the number of axis breaks
- expand
A numeric single value (default = 0.01), that will be the expanded margin to the axis
- thousand_mark
A character single value to use as the thousand mark
- decimal_mark
A character single value to use as the decimal mark
Examples
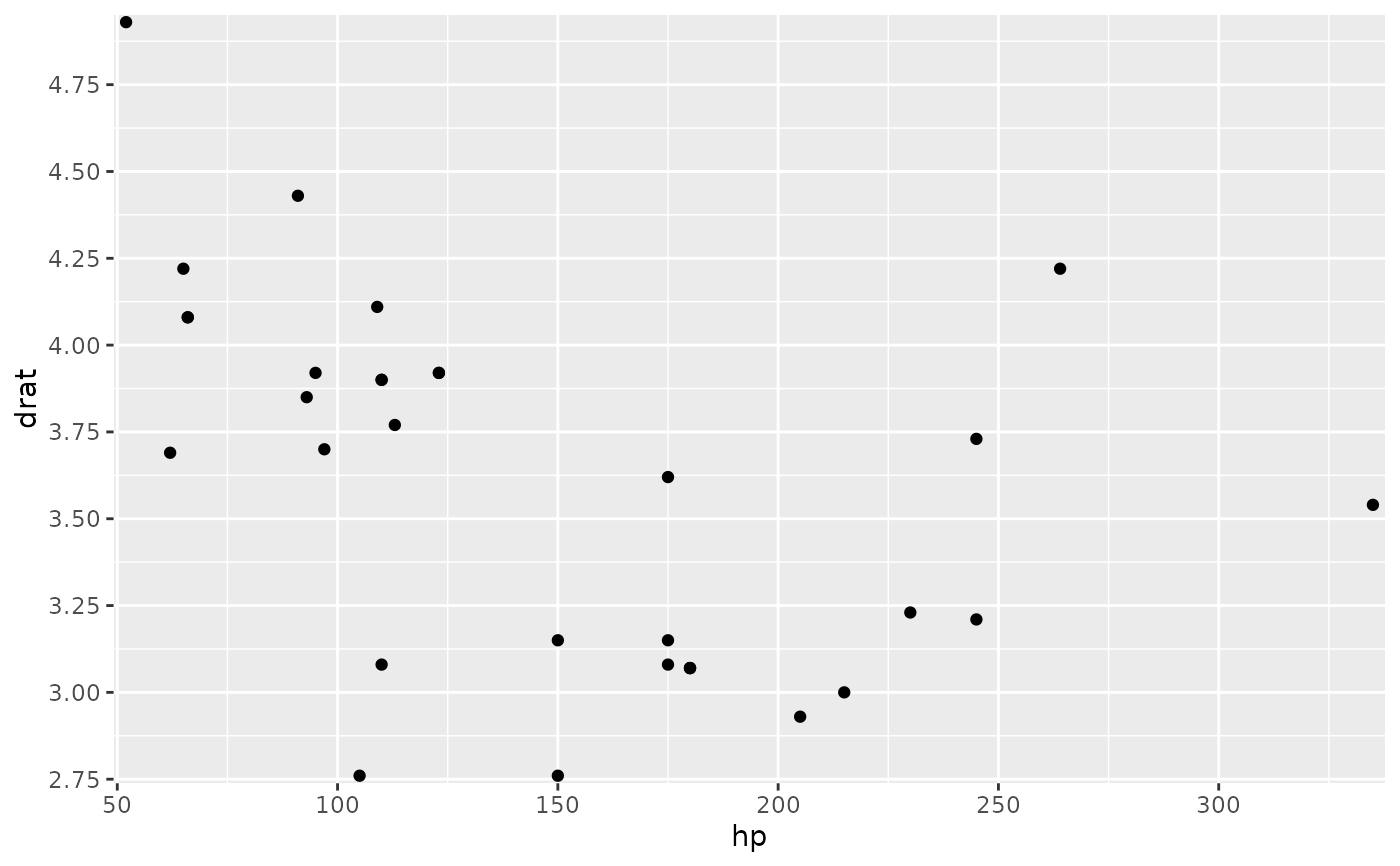
library(ggplot2)

plot <-
ggplot(mtcars,aes(hp,drat))+
geom_point()

plot+
 plt_scale_auto("x",n_breaks = 10)+
 plt_scale_auto("y",n_breaks = 10)