ggplot2: Add a regression line to a scatter plot
plt_regression_line.RdAdd a regression line to a ggplot2 scatter plot.
Examples
library(ggplot2)
plot <-
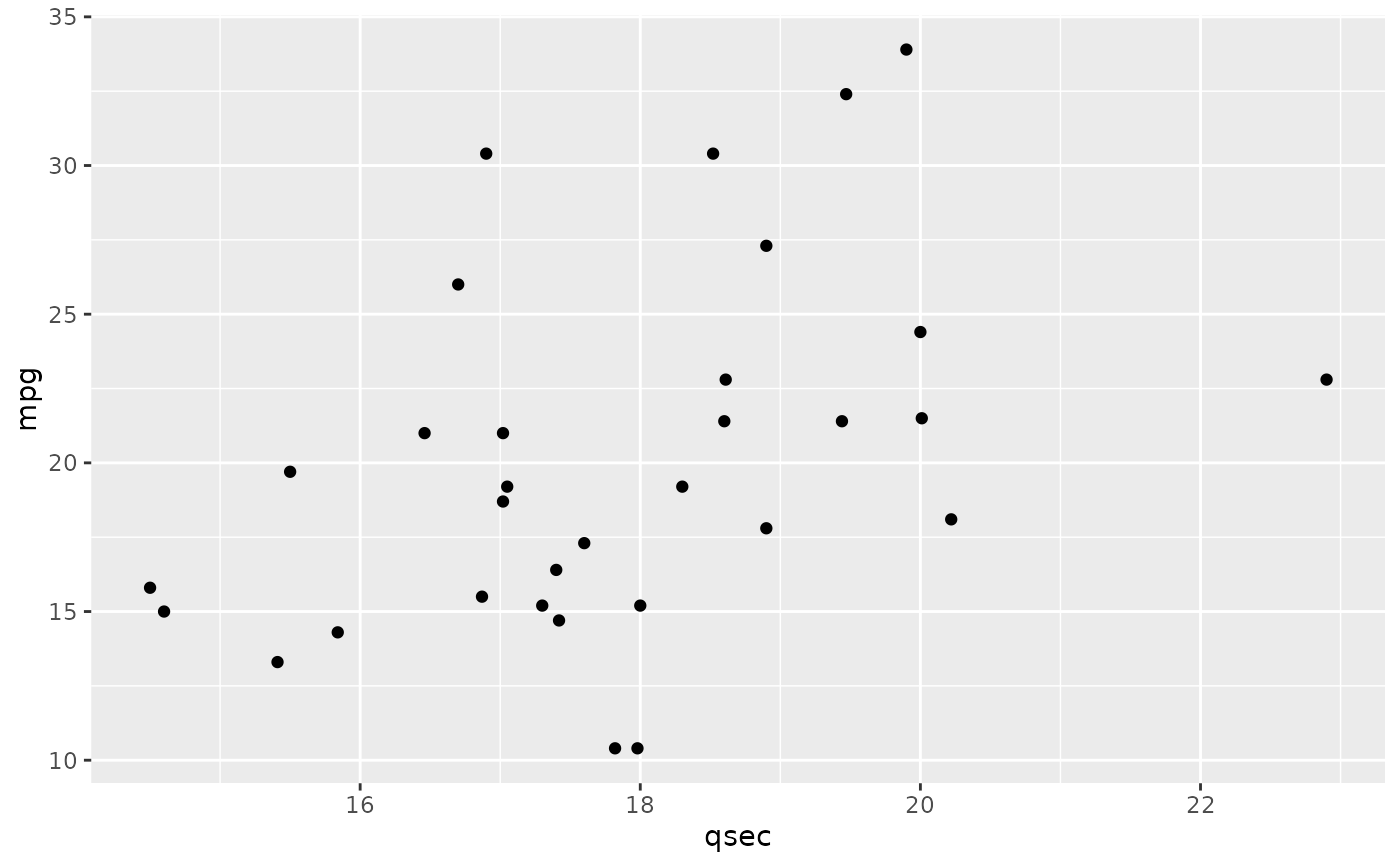
ggplot(mtcars,aes(qsec,mpg))+
geom_point()
plot
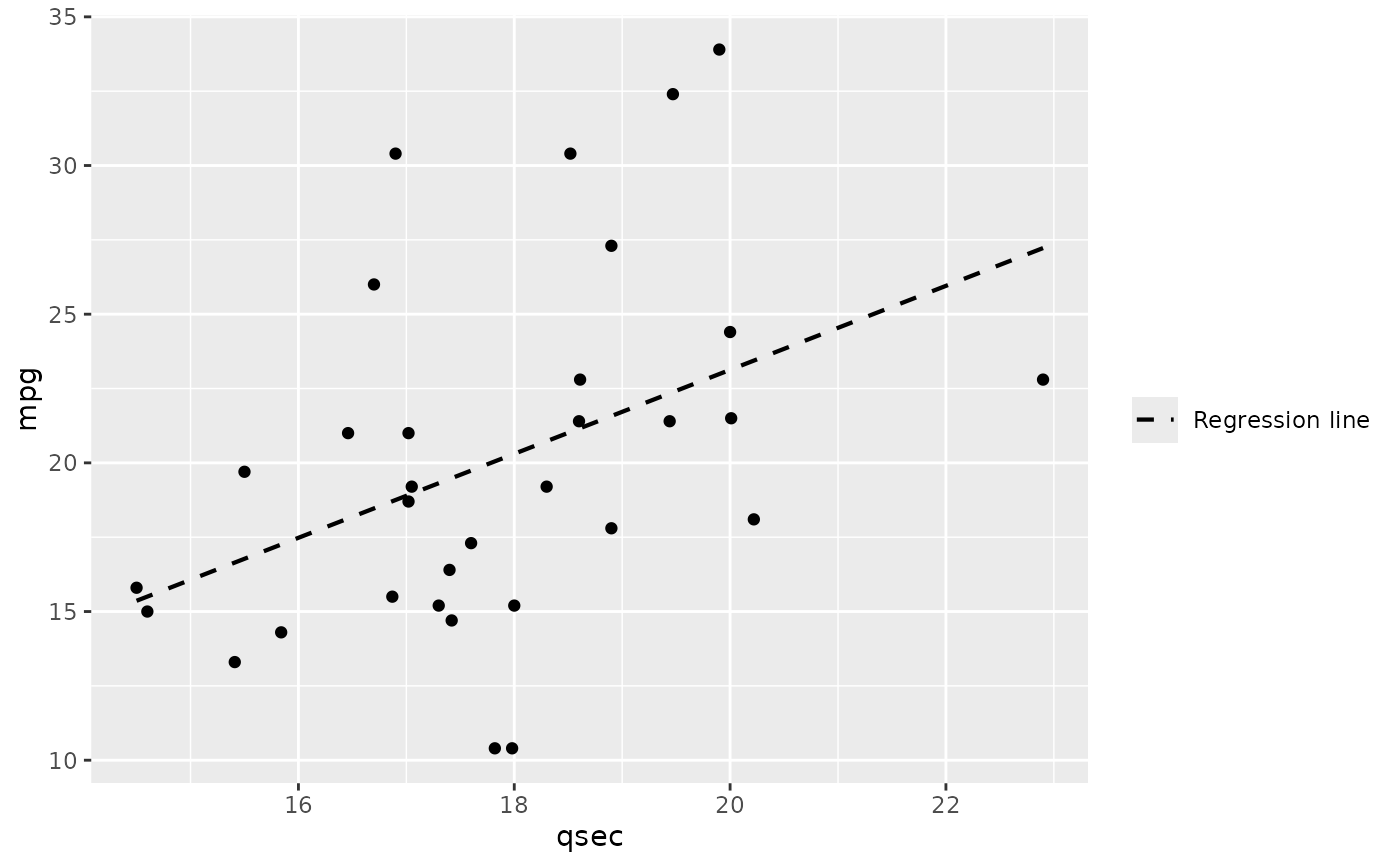
 plot + plt_regression_line()
plt_regression_line.RdAdd a regression line to a ggplot2 scatter plot.
library(ggplot2)
plot <-
ggplot(mtcars,aes(qsec,mpg))+
geom_point()
plot
plot + plt_regression_line()