ggplot2: Add a single point with two lines in a ggplot2
plt_pinpoint.RdAdd a single point in a ggplot2 scatter plot.
Arguments
- x
A numeric single value
- y
A numeric single value
- color
A character single value (default = 'firebrick3'), that will be the line color
- size
A numeric single value (default = 3)
- linetype
A character single value (default = 'dashed'), that will be the line type
- linewidth
A numeric single value (default = 0.75), that will be the line width
Examples
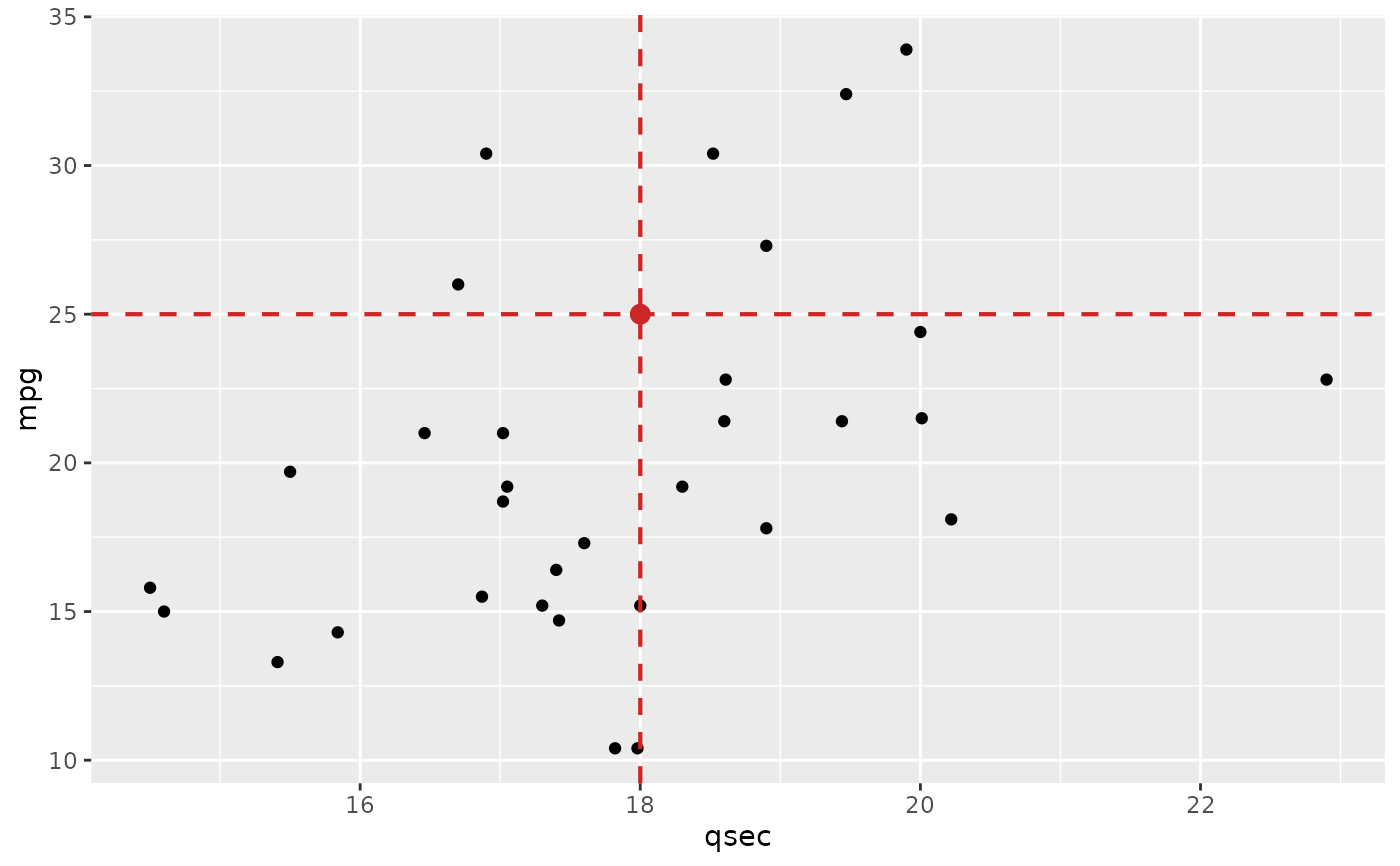
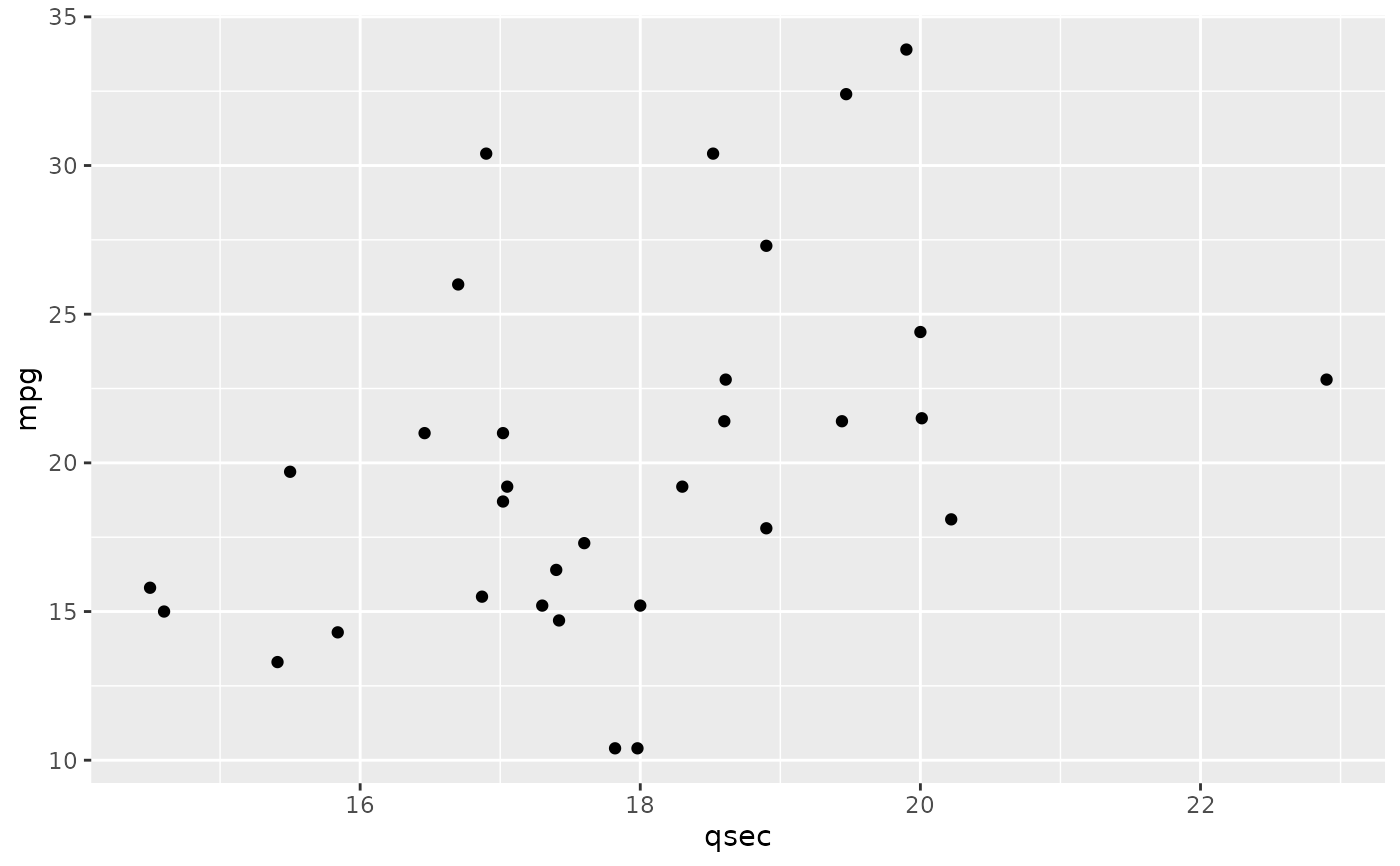
library(ggplot2)

plot <-
  ggplot(mtcars,aes(qsec,mpg))+
  geom_point()

plot


plot + plt_pinpoint(x = 18,y = 25)