In this post, we will see how a third party can show us the truth about a relationship.
Context
Simpson’s Paradox is a statistical phenomenon that occurs when an observed correlation between two variables in separate groups of data is reversed when compared to the overall correlation without taking the group into account.
When analyzing data, this phenomenon, named after statistician Edward Simpson, can lead to incorrect conclusions. Despite Simpson’s discovery in 1951, the concept had previously been noted by other researchers.
Example
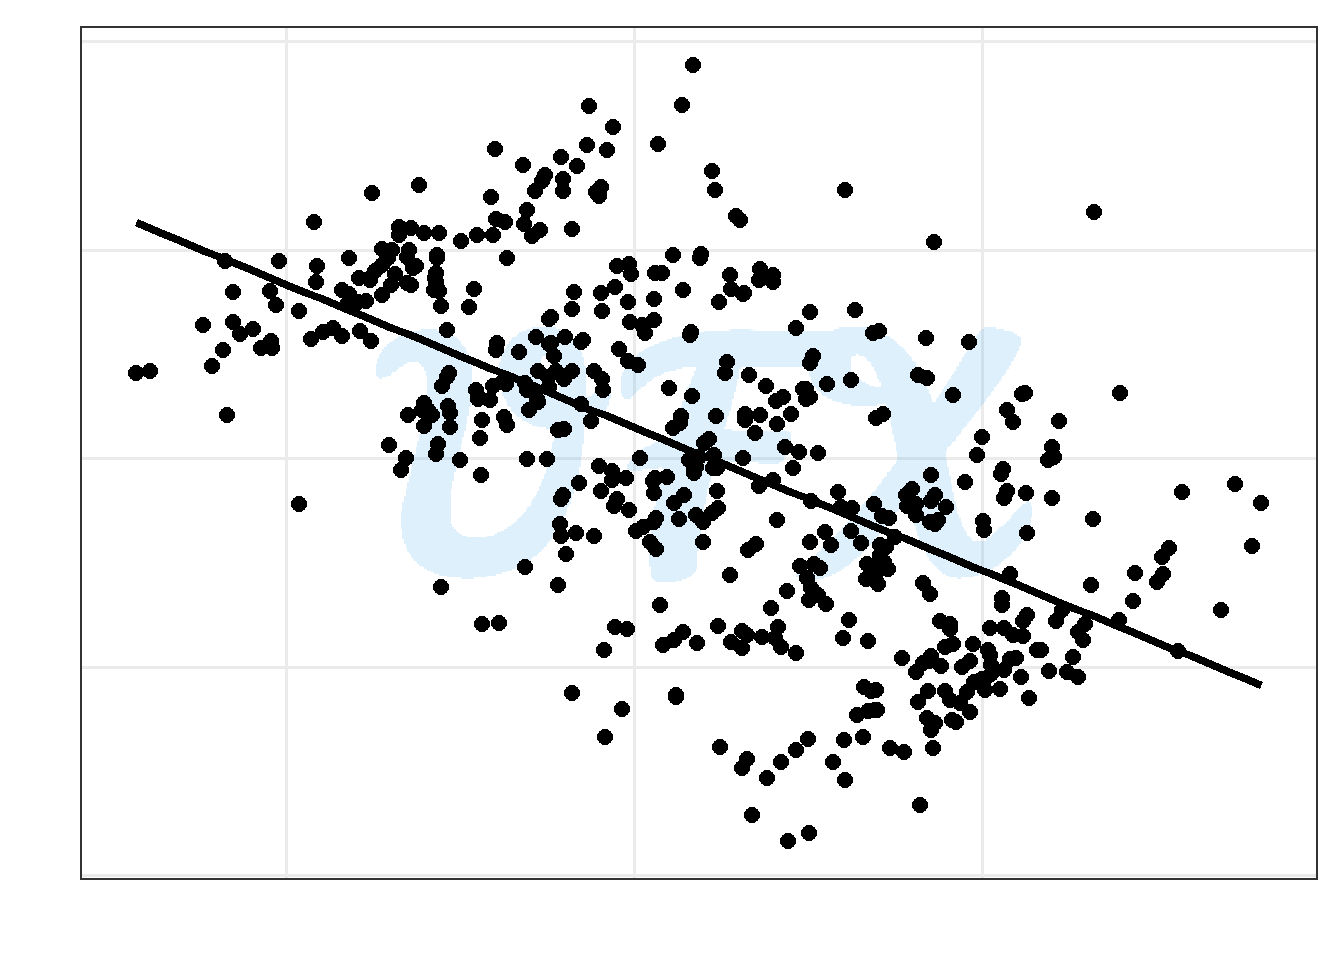
Assume we have two numerical variables.
As shown in the figure above, they have a moderate negative linear relationship with a pearson correlation coefficient of -0.589.
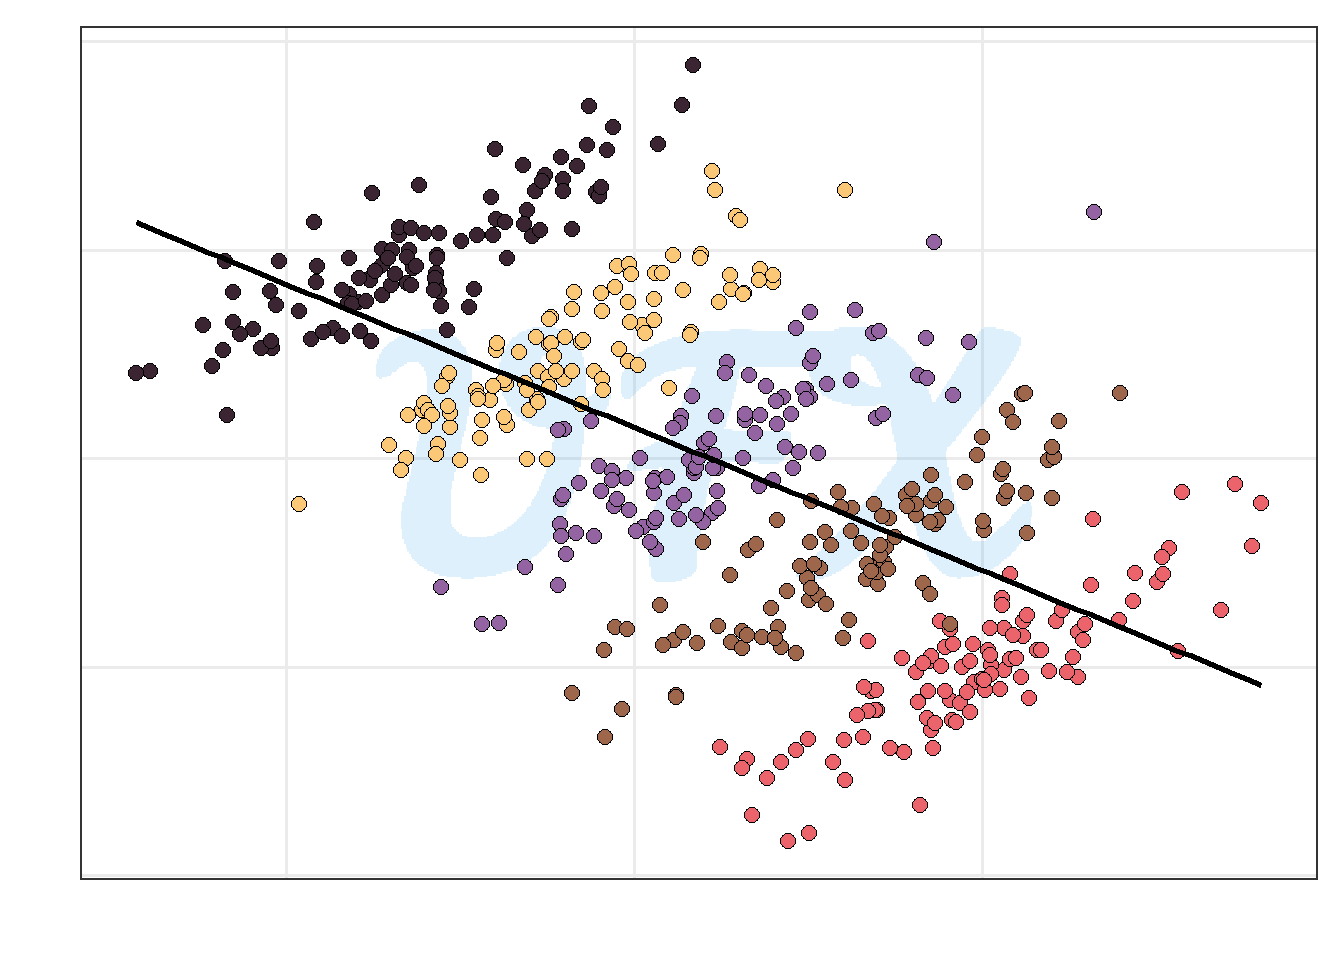
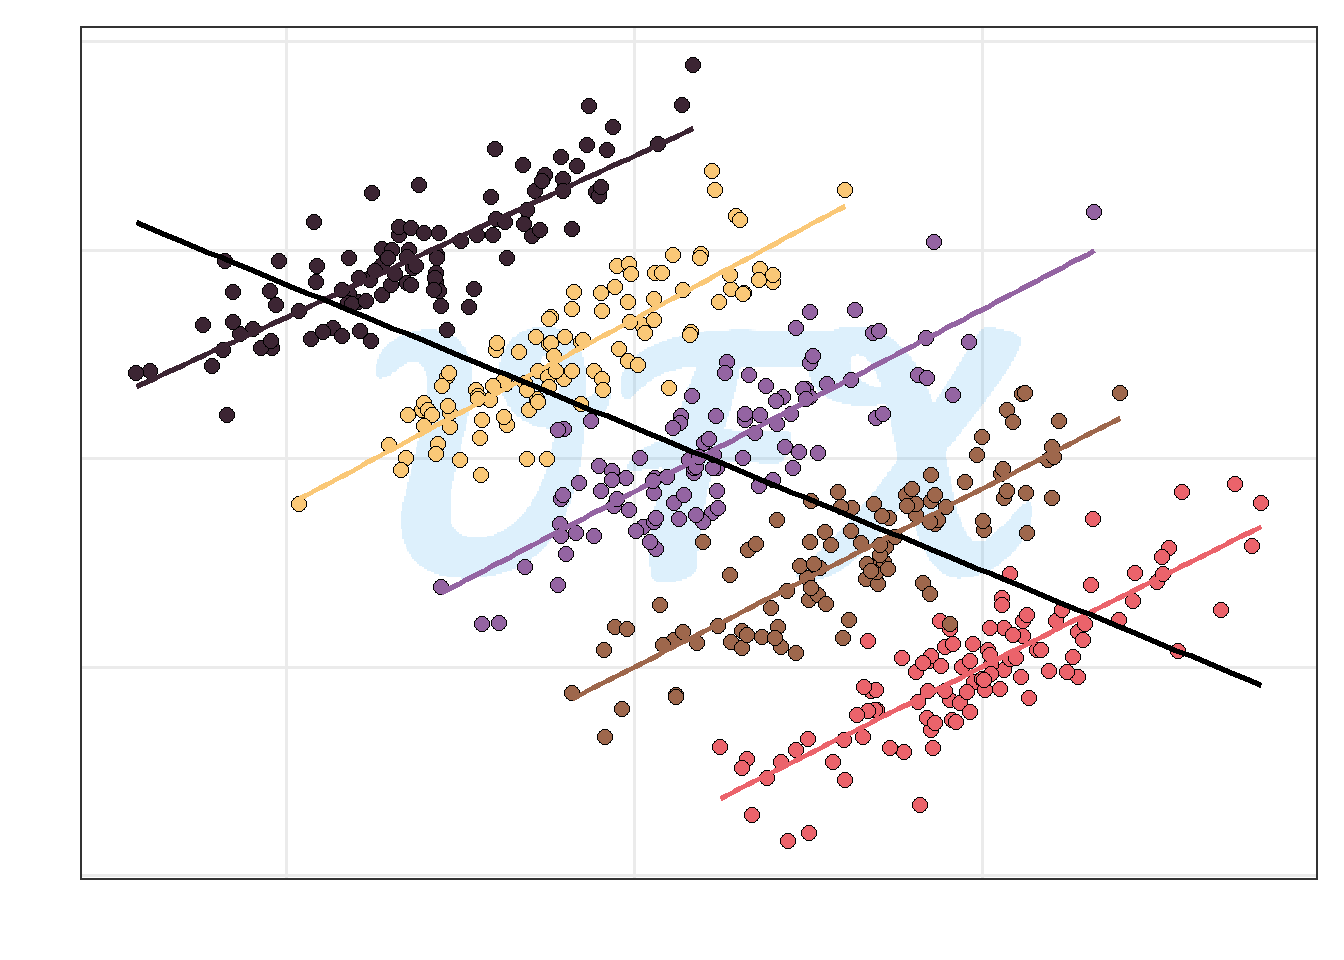
Now, we look at the data with a third categorical variable in mind, and we see that the correlation is positive for each level of this variable for each subgroup of data.
Considerations
This paradox highlights the importance of understanding biases and data selection in research, warning against drawing conclusions solely from observational data, particularly when dealing with complex variables. A lurking or hidden variable (confounder) is frequently to blame for the paradox. Be aware that this confounder has the potential to distort the apparent relationship between variables, resulting in counterintuitive results.
To ensure accurate interpretations of variable relationships, researchers must be cautious, taking into account data complexities and alternative explanations. Incorporate domain expertise as well to identify potential confounders or factors that may contribute to the paradox. Unexpected outcomes can be explained with a thorough understanding of the subject.