In this post, we will see how a selection can invert a relationship.
Context
It was described by Joseph Berkson (Berkson 1946) when two attributes that are individually positively correlated, but given a third variable or a baised selection, they appear to have a negative correlation when examined together.
This counterintuitive phenomenon occurs as a result of data collection selection bias. Patients with multiple health conditions, for example, are more likely to be admitted in a hospital setting, resulting in a skewed sample that does not reflect the general population.
Example
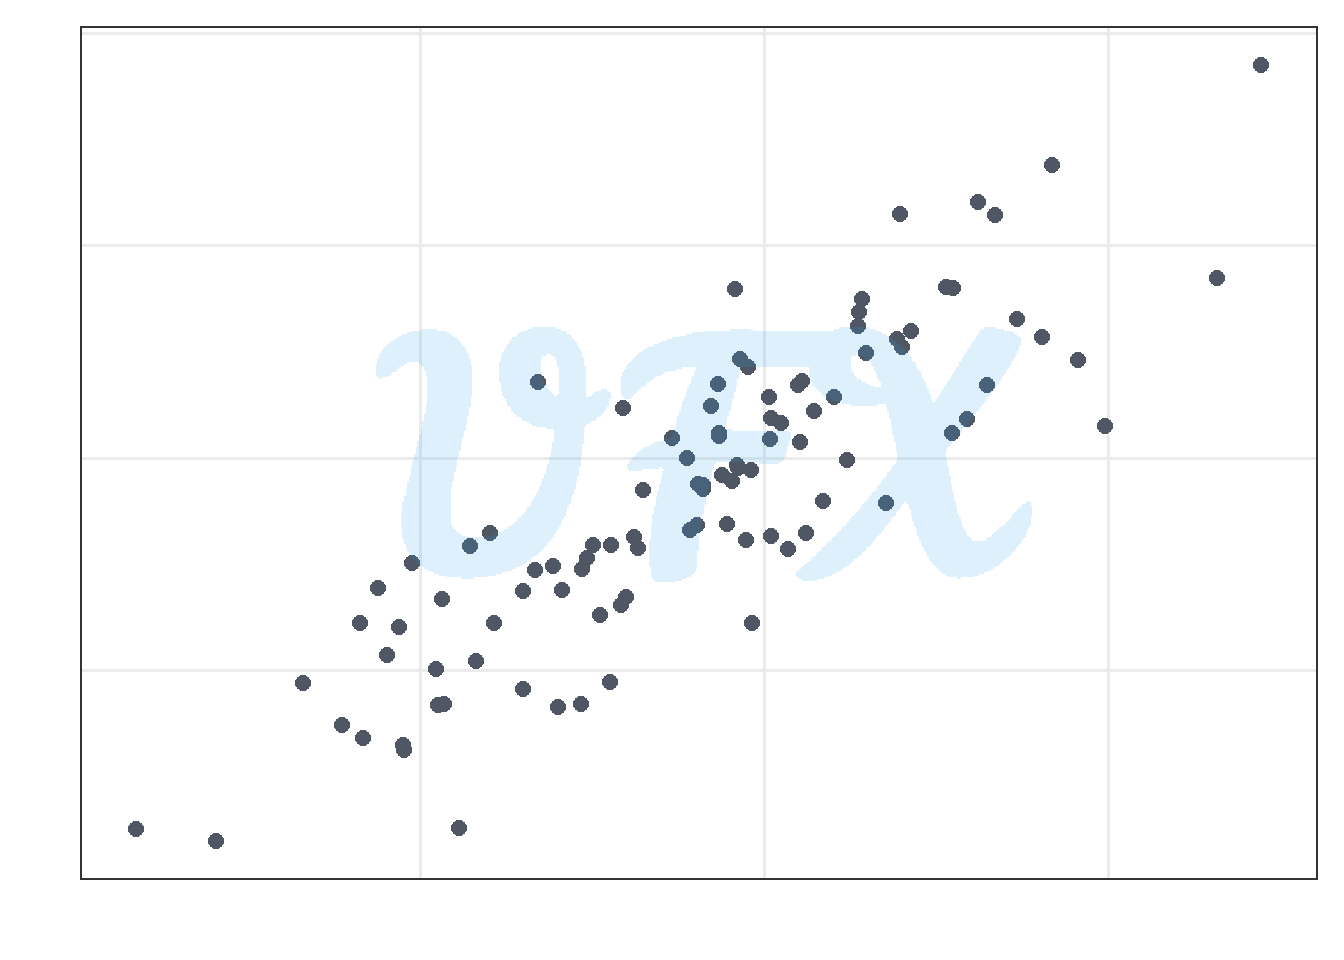
Assume we have two numerical variables.
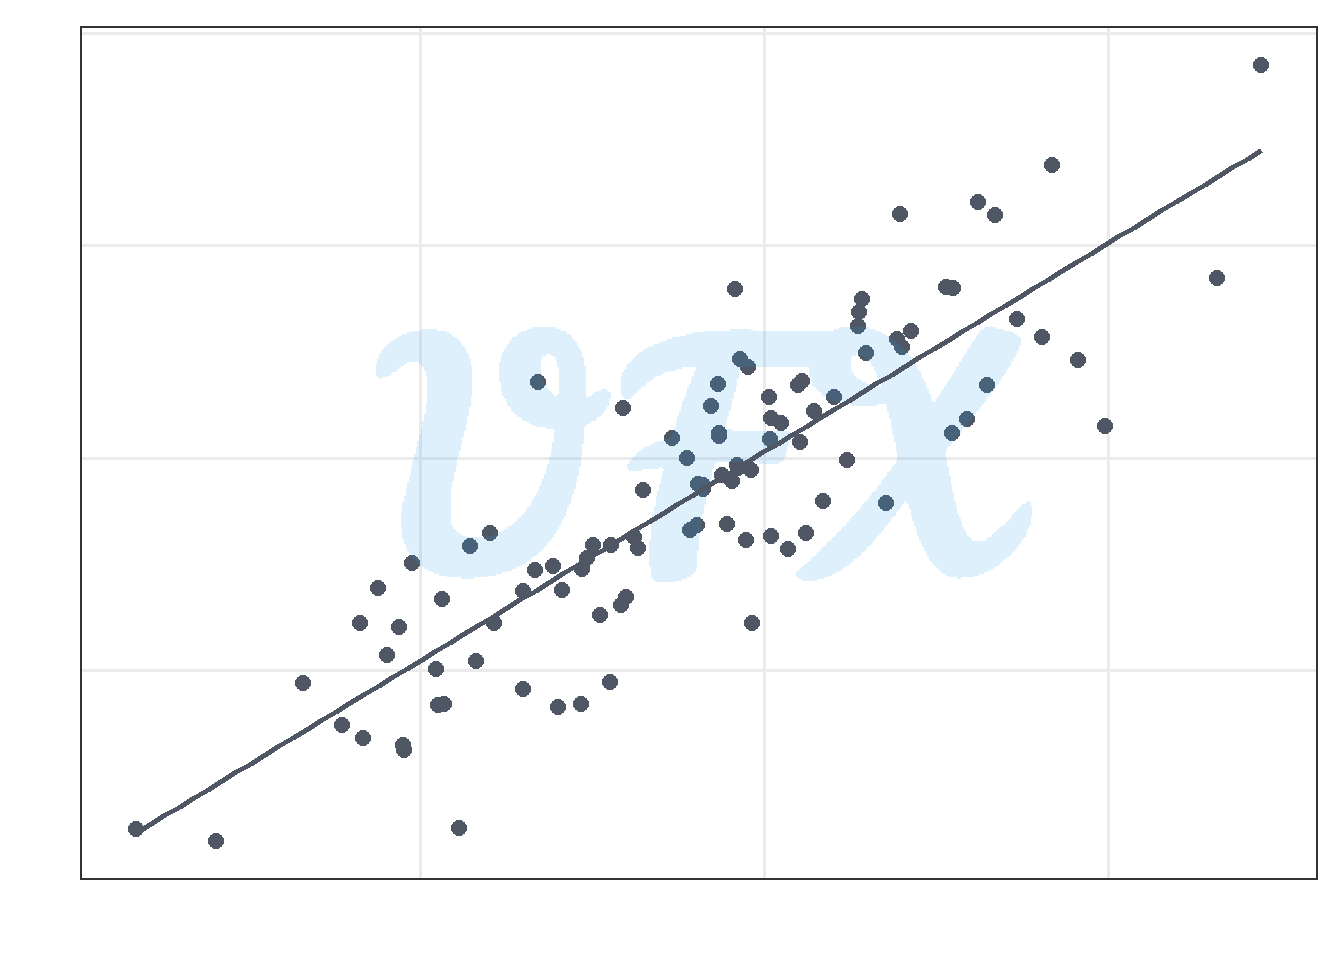
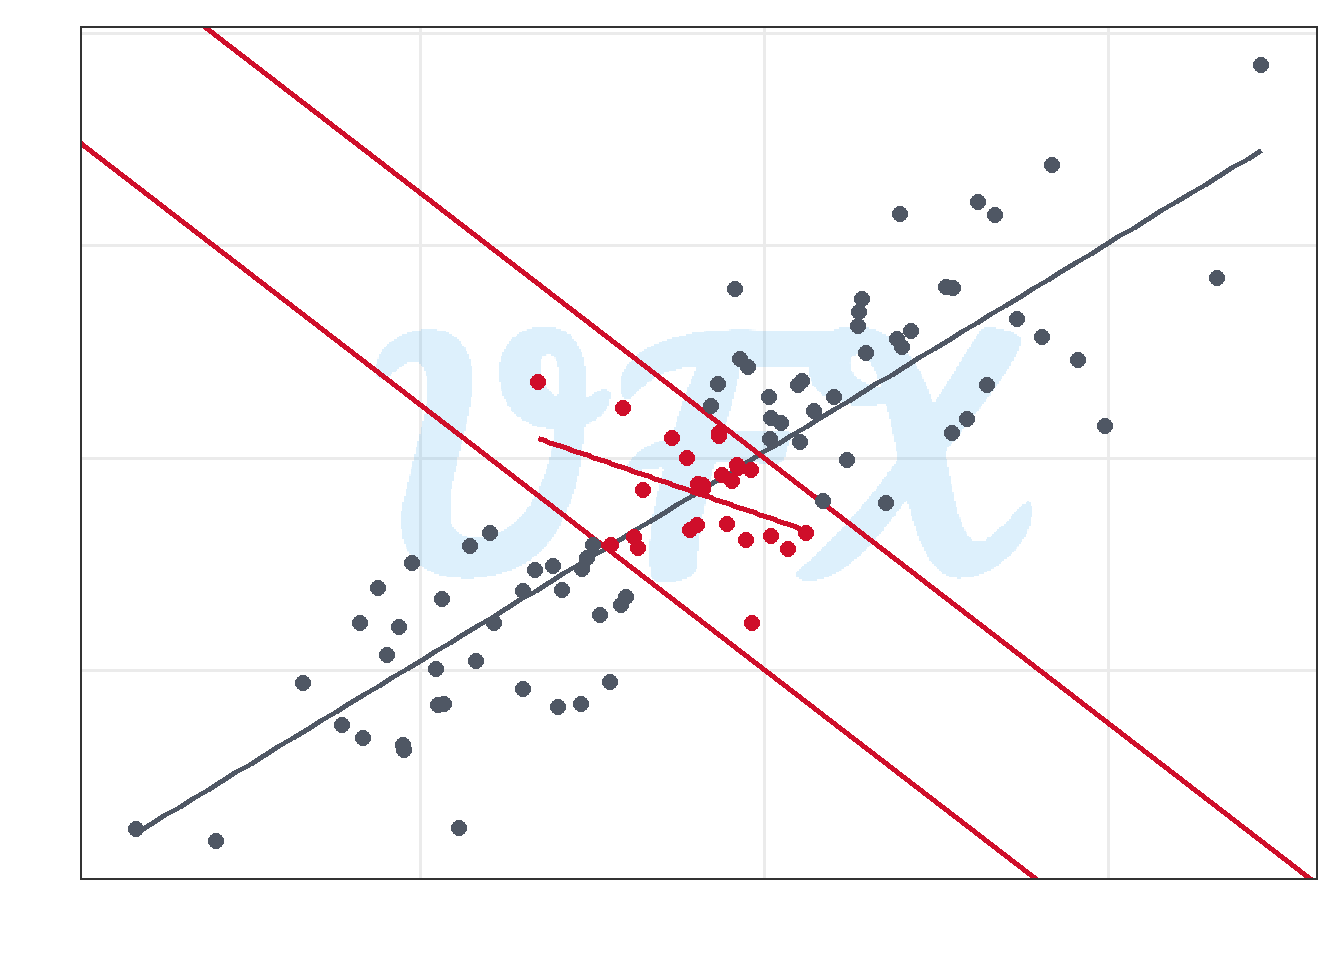
As shown in the figure above, they have a strong positive linear relationship with a pearson correlation coefficient of 0.859.
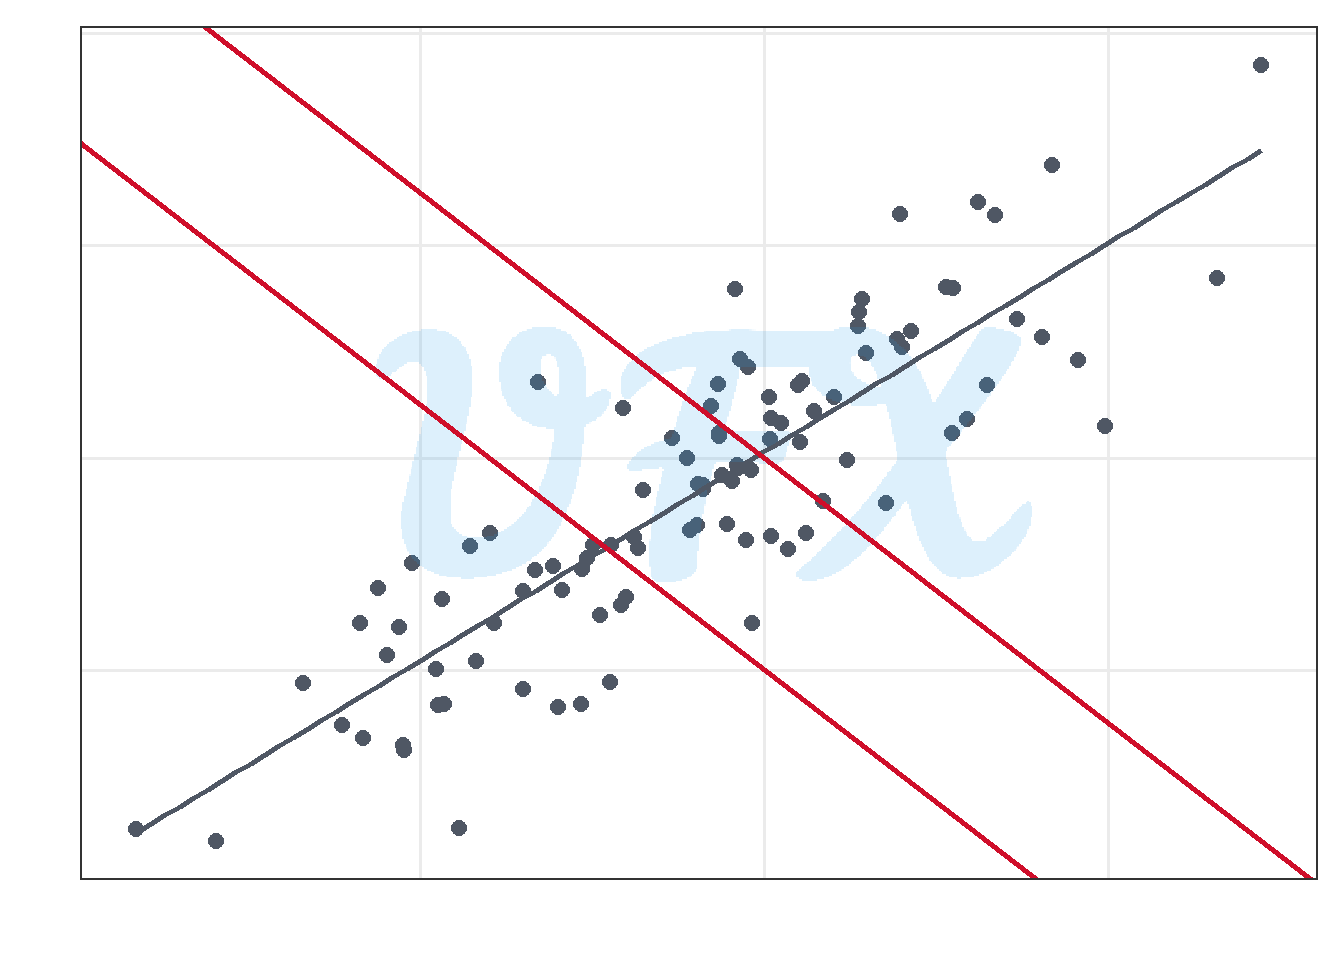
Now, we will do a selection of a determined section of our data.
We can see that the overall relationship between the variables differs if we only look at the data in the new section.
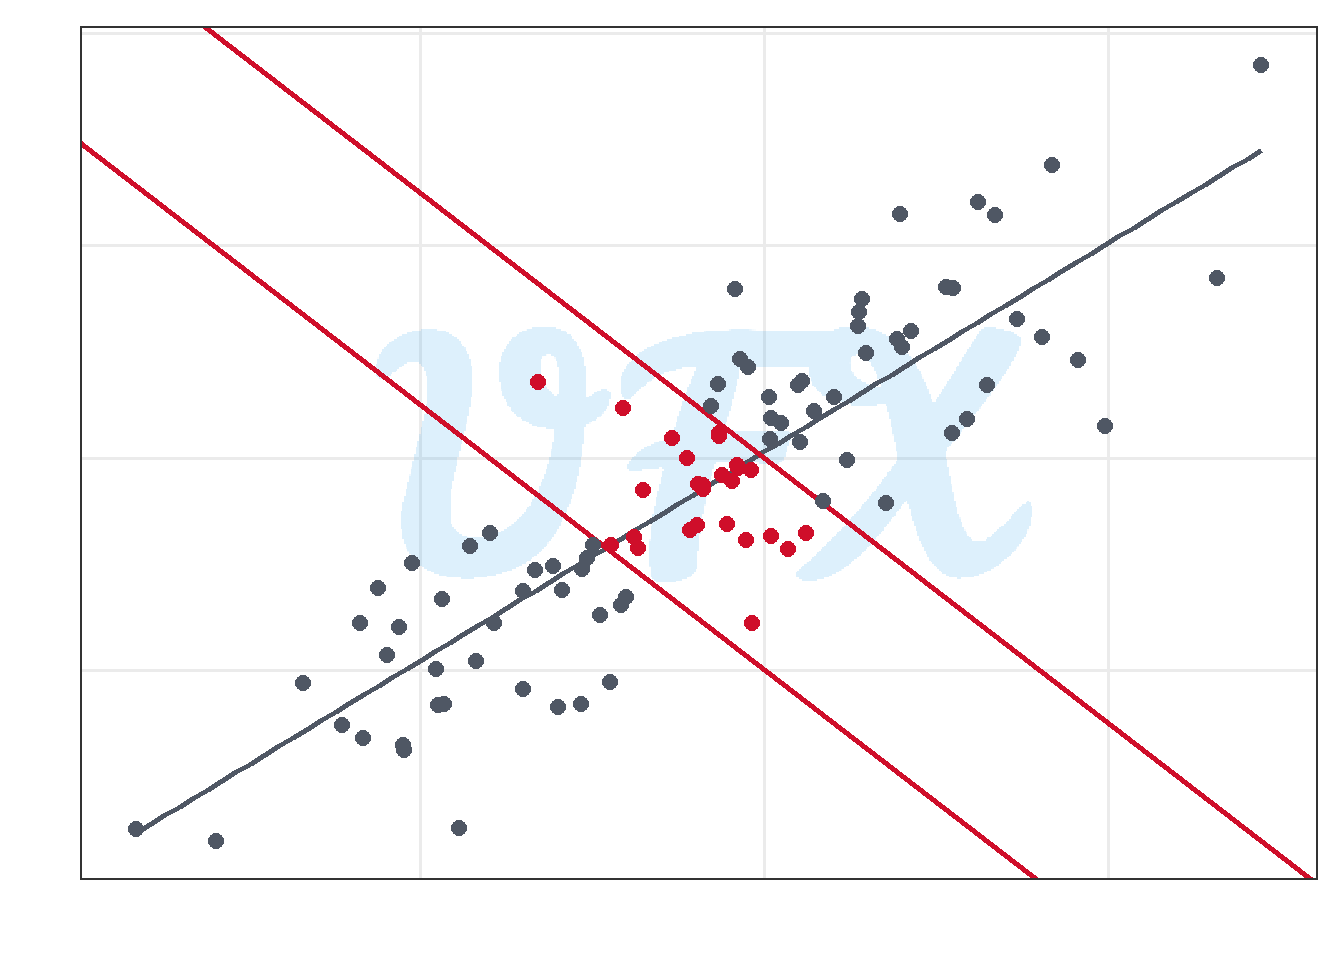
With a pearson coefficient of -0.389, the correlation is now negative, reversing the original relationship.
Considerations
This paradox highlights the importance of understanding underlying biases and data selection processes. It emphasizes the risks of drawing conclusions solely from observational data, particularly when complex variables are involved.
To accurately interpret relationships between variables in their studies, researchers must be cautious, taking into account the nuances of their data and accounting for alternative explanations.
References
Berkson, Joseph. 1946. “Limitations of the Application of Fourfold Table Analysis to Hospital Data.” Biometrics Bulletin 2 (3): 47. https://doi.org/10.2307/3002000.